Featured Article
Indian Market Cycles:
Drawdowns, Tranches & the Discipline of Recovery & Outsized Returns

Prashant Joshi

April 15, 2026

10 Min
Listen On The Go!
No items found.

AT A GLANCE:
Indian equity markets have moved through six distinct drawdown cycles since 2008. Each carried its own narrative — global financial crisis, eurozone contagion, COVID, rate tightening. Each produced conviction, in the moment, that recovery would be slower or structurally different this time.
None of them were.
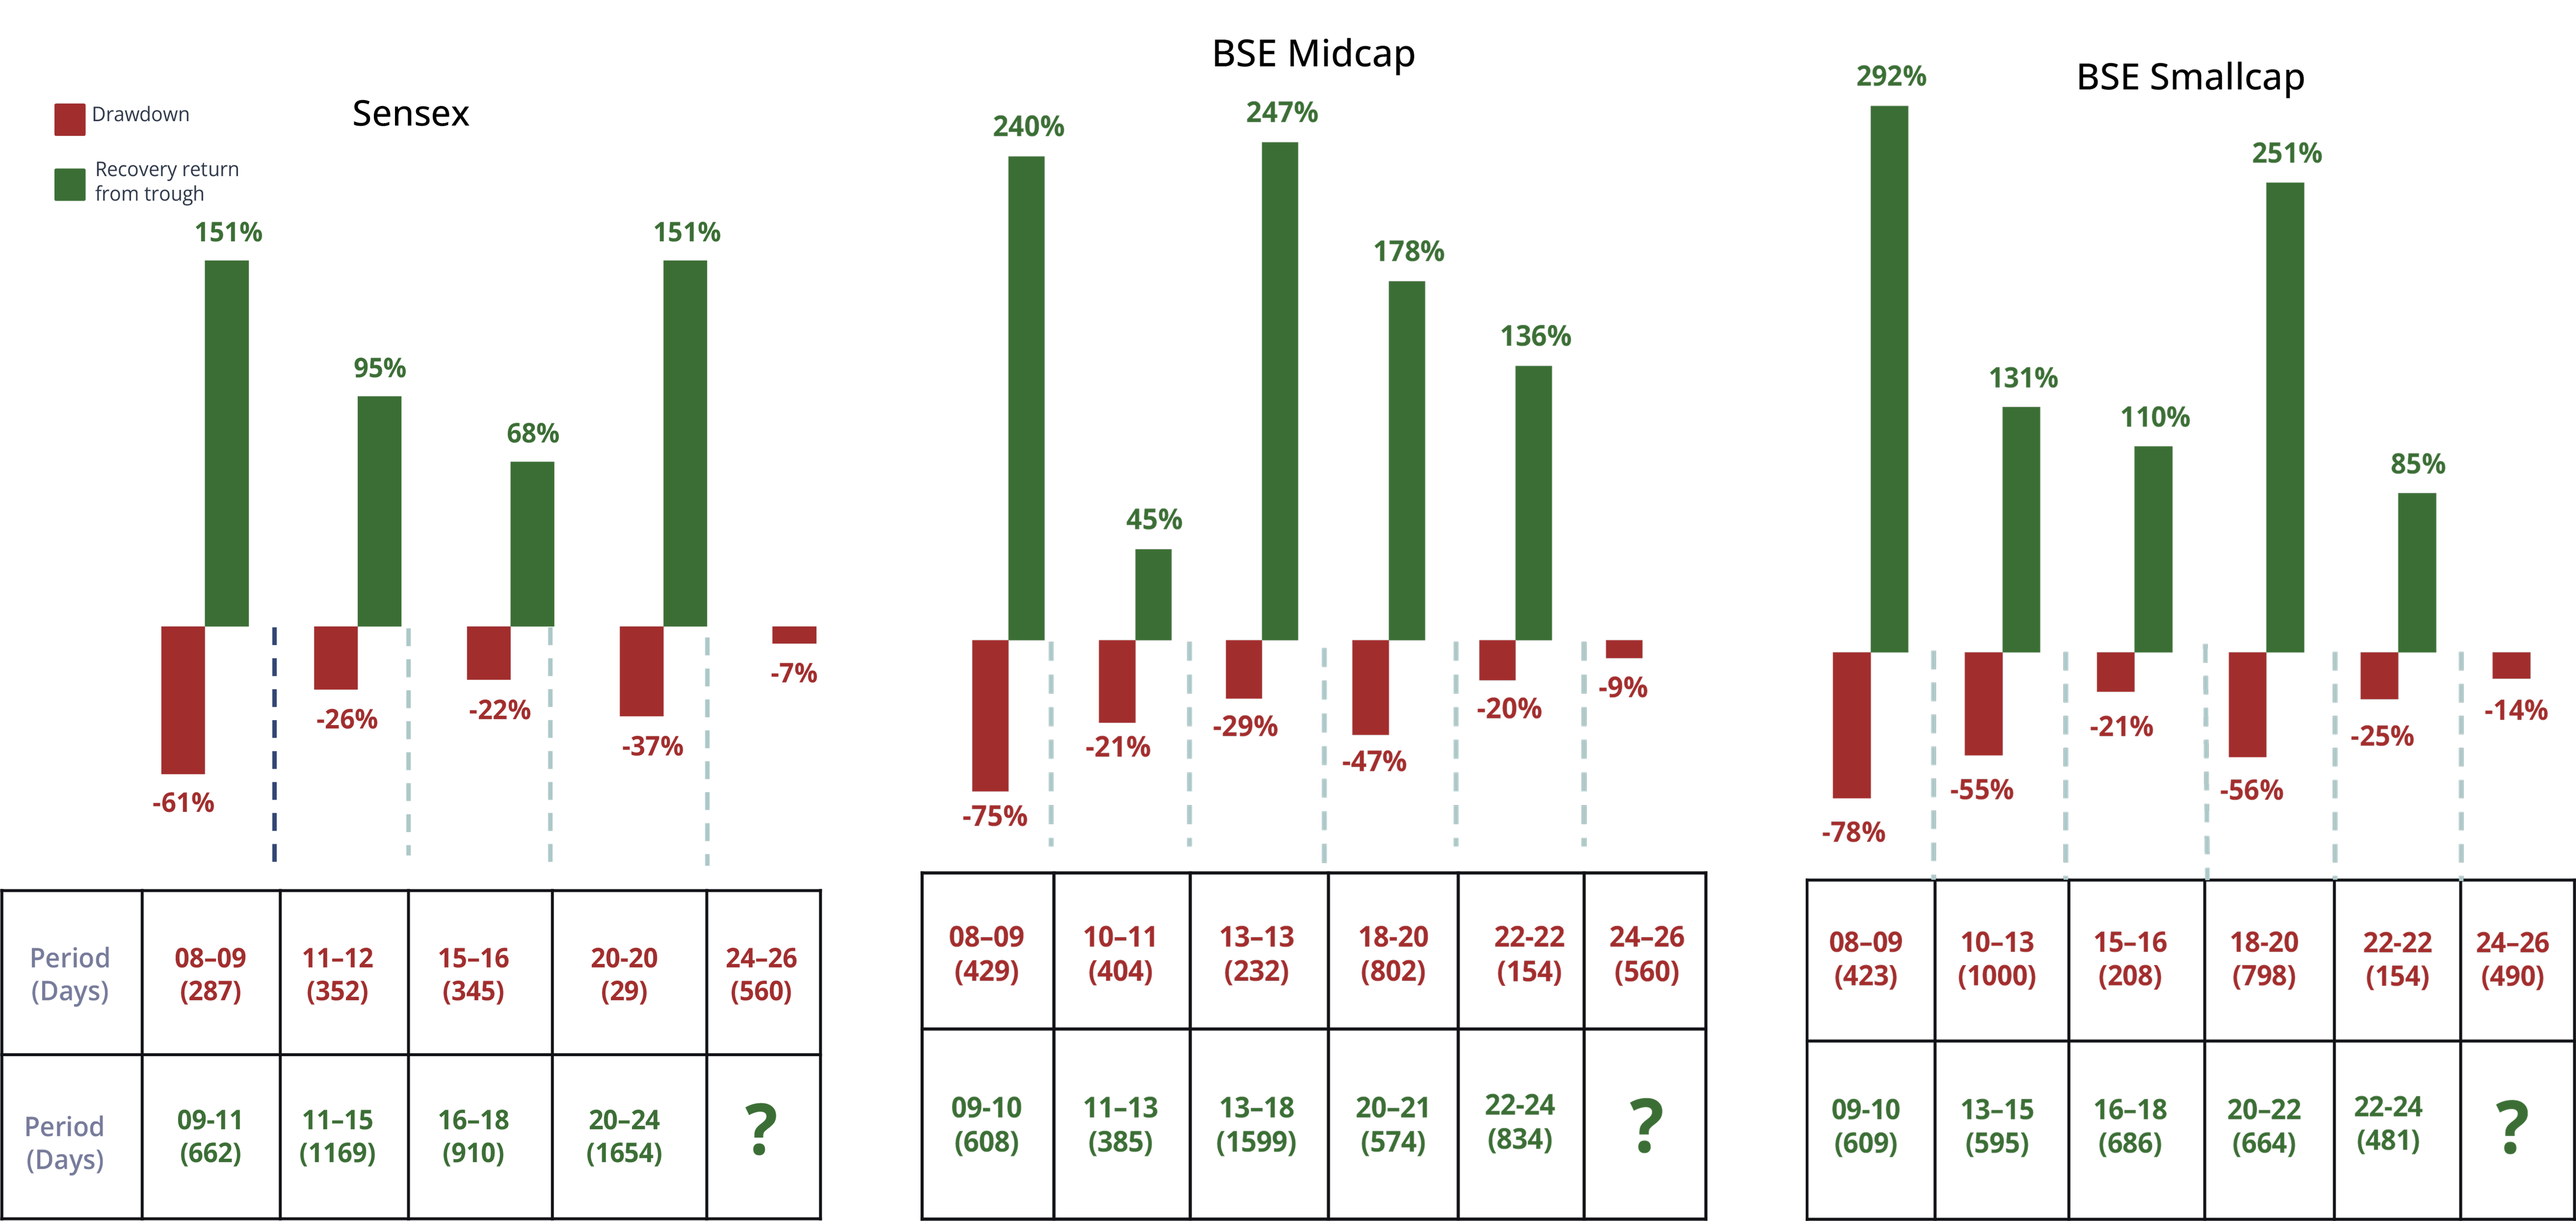
Across all three indices — Sensex, BSE Midcap, BSE Smallcap — every drawdown has resolved into a new high. The relationship between depth and recovery magnitude has been consistent: the 2008 Smallcap decline of 78% was followed by a 292% recovery; the 2018 Midcap correction of 47% yielded 178% from trough.
Investors who waited for confirmation missed the steepest part of the recovery. The discipline that compounded wealth was acting before the picture cleared.
Each bar pair shows drawdown (red) and subsequent recovery return (green) for a completed cycle.
*As of 15th April 2026
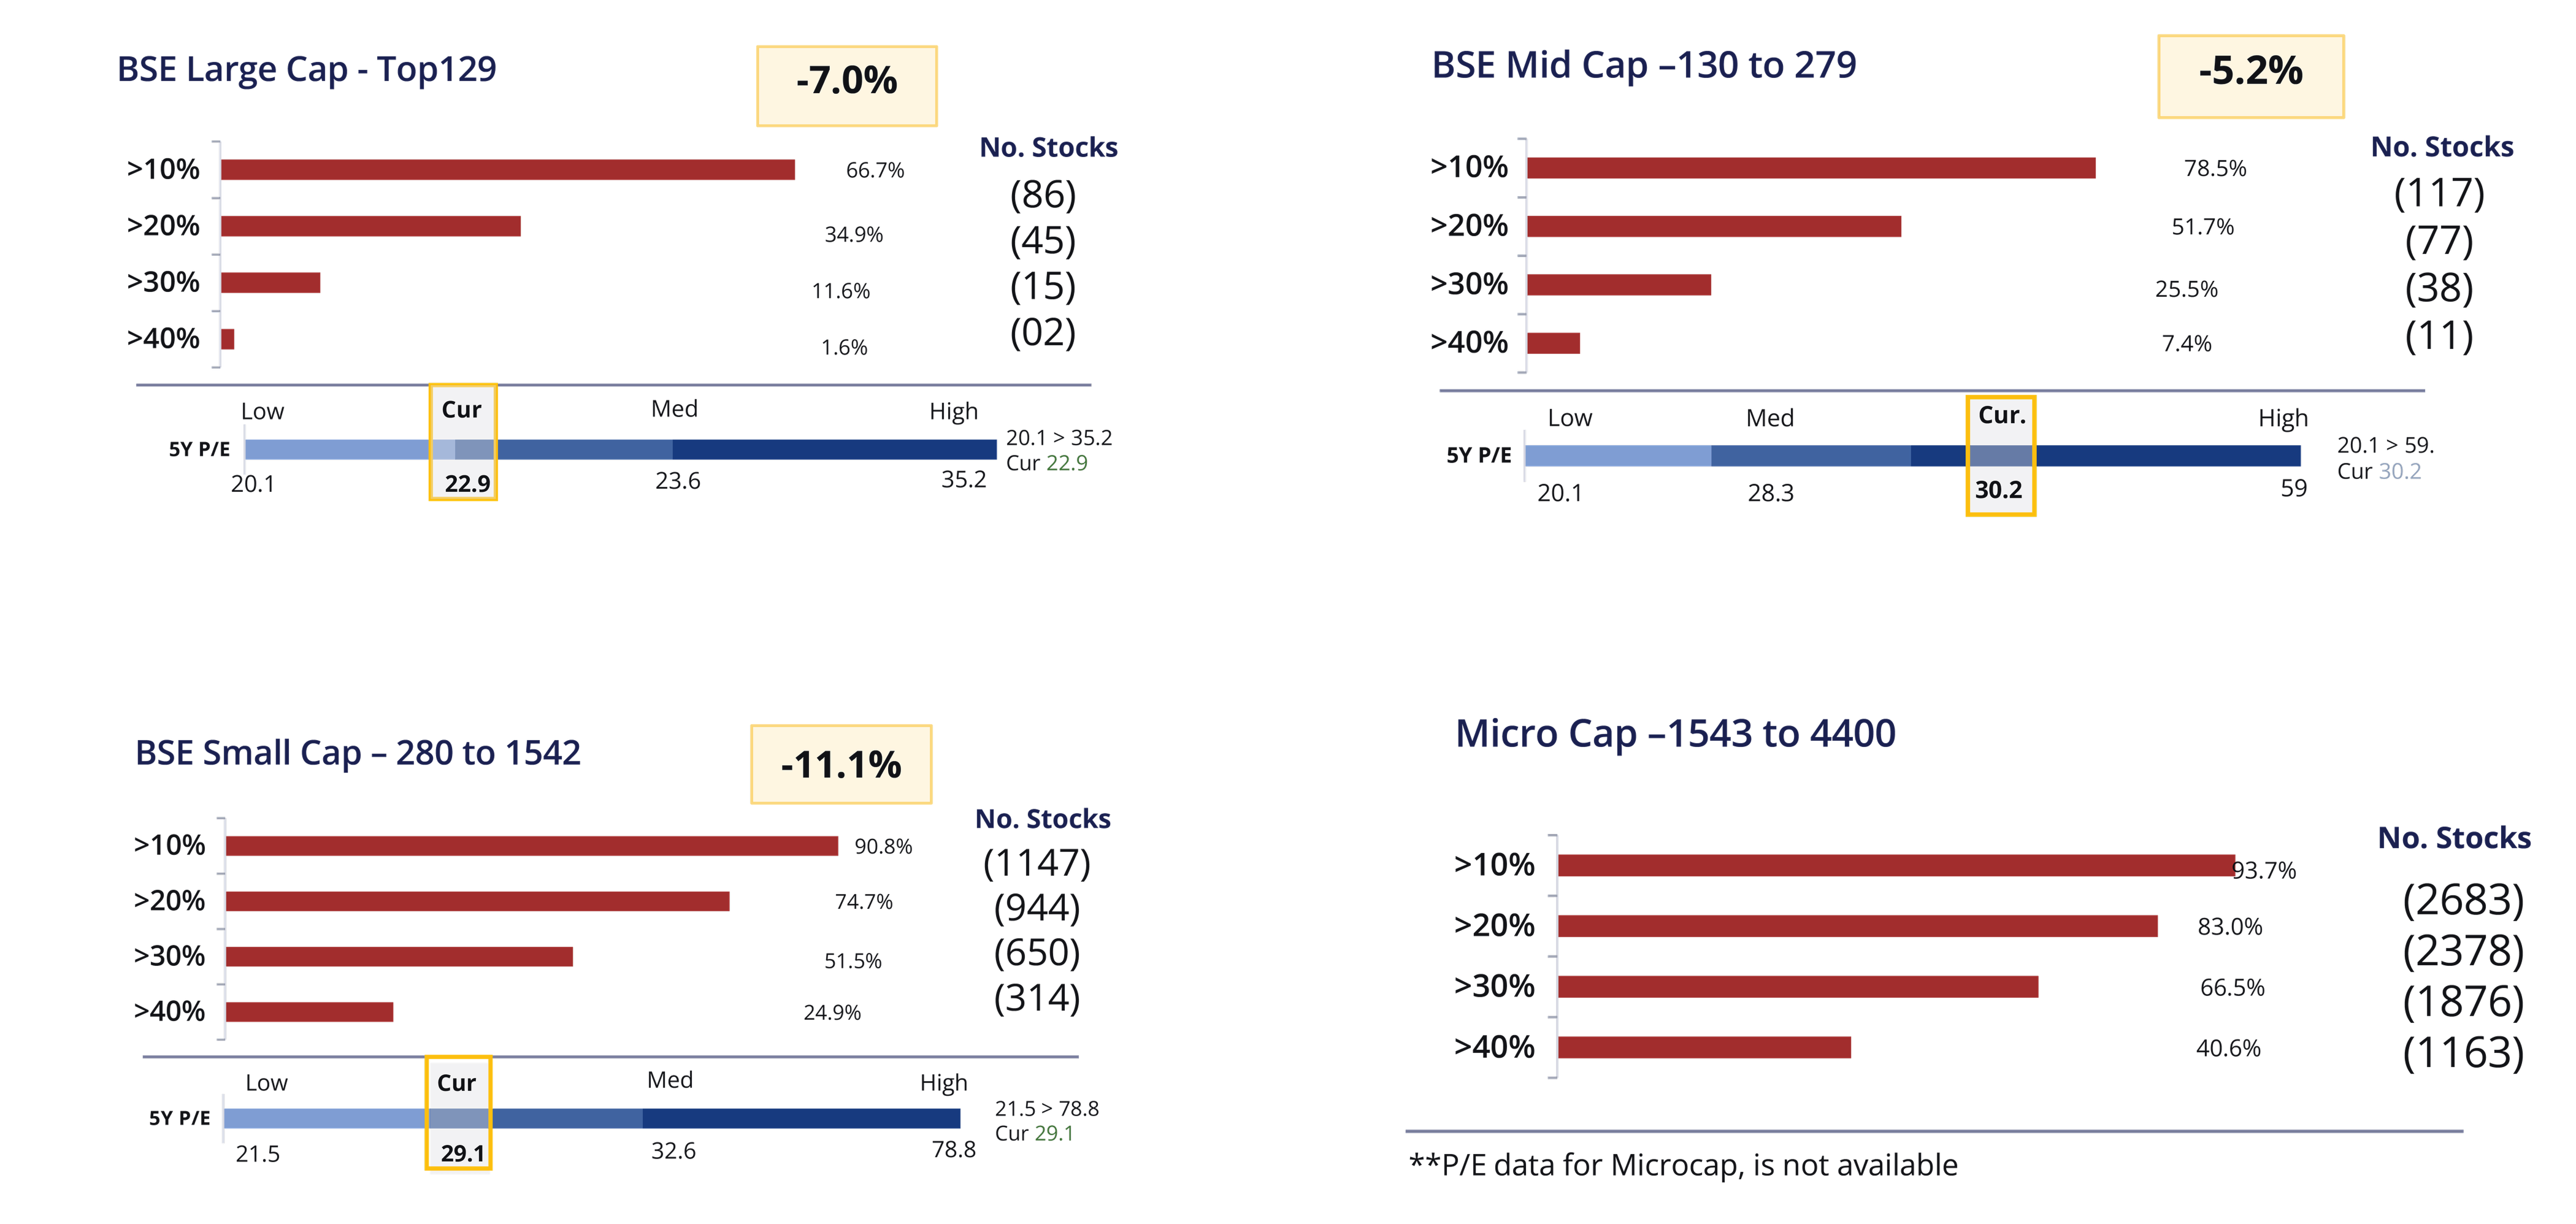
Despite relatively moderate index-level corrections, individual stocks - especially small & microcaps - show significantly deeper drawdowns.
*As of 15th April 2026
*As of 15th April 2026
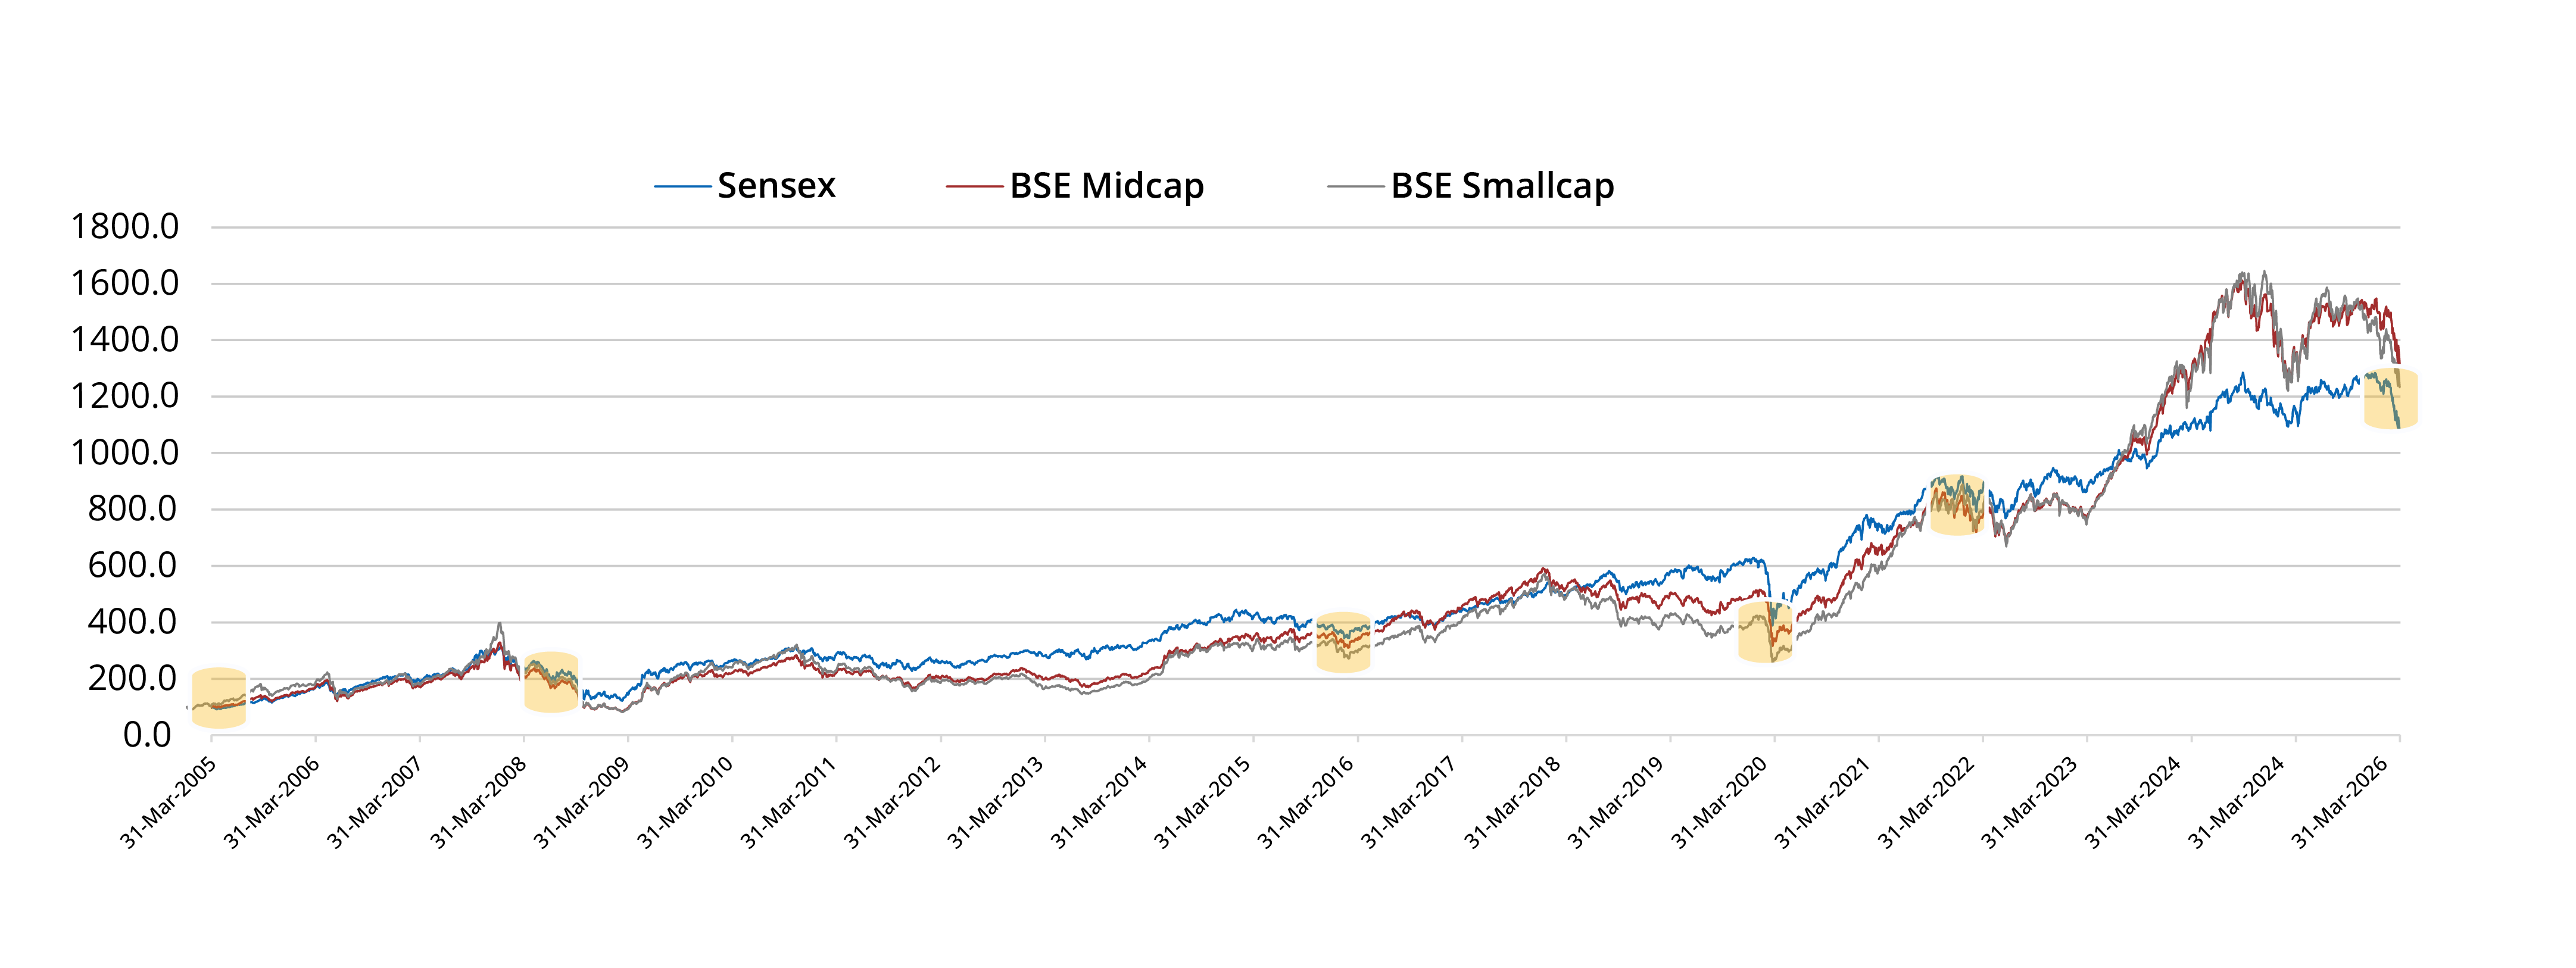
In the past 21 years, this has happened now for the 6th time – A rare feat
*As of 15th April 2026
Every prior downcycle in this dataset has recovered fully and made new highs. The data does not tell us when the recovery will begin - it never does. What it does tell us, with considerable consistency, is that it will.
“Market corrections create opportunities to accumulate quality assets at lower valuations, allowing investors to capture future growth at favorable entry multiples and generate outsized returns over time.”