Executive Summary
This analysis examines seven years (rolling returns) of actively managed funds’ returns across decades and across different market capitalisations in the Indian equity markets. Its analysis highlights how well active management strategies work in each segment. The findings show that active management’s ability to produce consistent excess returns above a benchmark depends more on the specific market segment.
Large-cap and mid-cap strategies are having a hard time, often failing to outperform their benchmarks due to challenges like market volatility and increased competition. In contrast, small-cap strategies are doing well, consistently generating better returns than expected. The analysis also shows that factor-based indices are becoming popular as reliable investment options. These indices provide better risk-adjusted returns, helping investors navigate various market conditions and diversify their portfolios effectively.
Key Highlights: Index Trends
The seven-year returns of major indices show important changes. Over seven years, the Nifty 50 has usually outperformed the Nifty 500 and Nifty Small Cap 250. The only exception is the last decade, during which the Nifty 500 slightly outperformed the Nifty 50. Compared to the Nifty Midcap 150, performance has varied. However, over the past decade, midcaps have generally outperformed. The Nifty 50 has a 12.9% compounded annual growth rate (CAGR), while midcaps have a 17.2% CAGR.
Although the Nifty 50 and Nifty Midcap 150 showed strong returns, actively managed small-cap funds provided the highest excess returns, followed by flexi-cap funds.
7 Year Mean Rolling Returns
Nifty Smallcap 250 (Small)
Active Funds Outperformance Trends
The success rates of active management have changed a lot across different types of funds. Small-cap funds have stayed fairly strong, dropping from 94% to 71%. Flexi-cap funds have seen a moderate decrease, going from 81% to 47%. Large-cap funds are facing big challenges, falling from 83% to 39%. Mid-cap funds have dropped the most, from 84% to 21%.
7 Years Rolling Returns with a Monthly Shift
Mild Decline
(94% to 71%)
71% (25 Funds)
Majority Outperformers
2% - 10%
Flexi
Cap
Moderate Erosion (81% to 47%)
47% (31 Funds)
Broad Outperformers
0% - 5%
Mid
Cap
Sharpest Decline (84% to 21%)
21% (7 Funds)
Sparse Outperformers
0% - 2%
Large
Cap
Significant Drop (83% to 39%)
39% (11 Funds)
Limited Outperformers
0% - 5%
As of 30th September 2025, Category: Large Cap, Flexi Cap, Mid Cap, & Small Cap | Universe: Equity Mutual FUnds, PMS, & AIF | Data Source: Upwisery Research Team & NAV Data from Morning Start/AMFI/PMS Houses | 2010-2021 (First Decade), 2012-2022, 2013-2023, 2014-2024, 2015-2025 (Latest Decade)
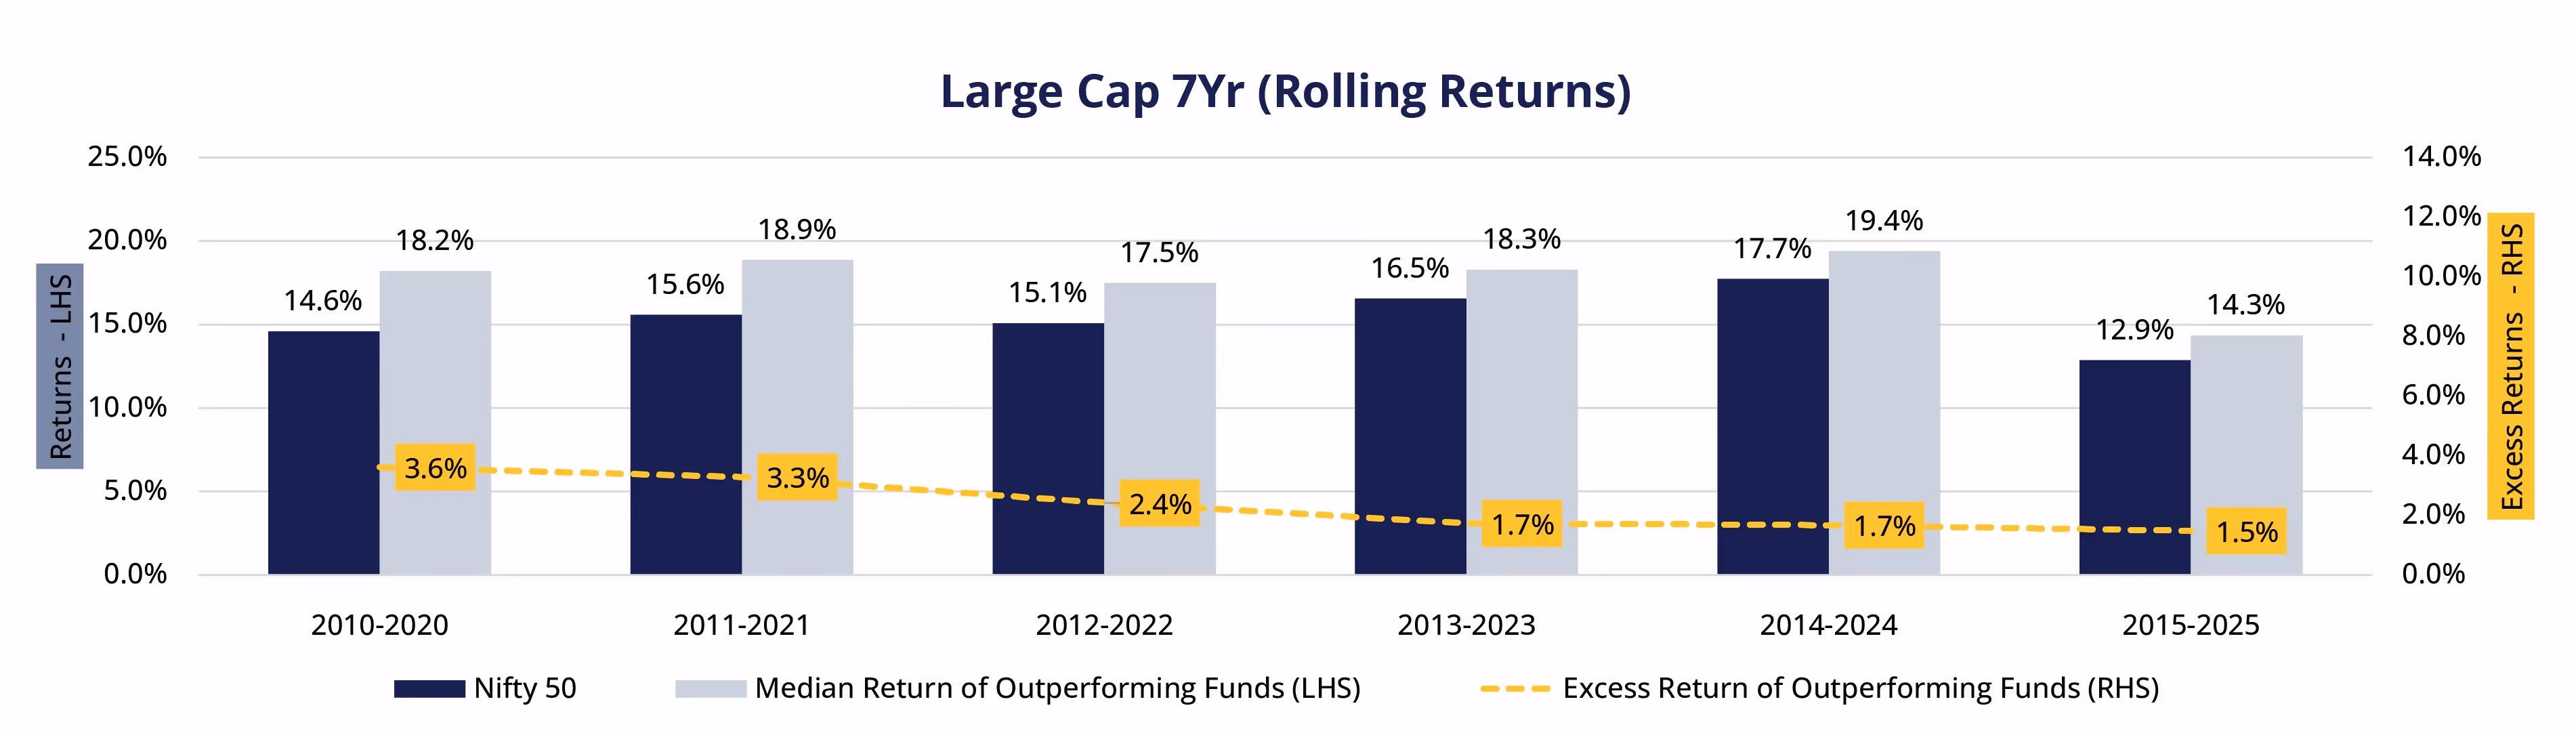
Large-Cap: Declining Active Outperformance
The large-cap segment shows that fewer funds are outperforming the market. The number of funds has stayed steady at 24 to 28, but the number that outperform has dropped from 20 (83%) to 11(39%). Now, most outperforming funds fall into the 0-2% return range, with 8 of the 11 funds in this category. The 5-10% return range, which had six funds from 2010 to 2020, no longer exists in the latest period.
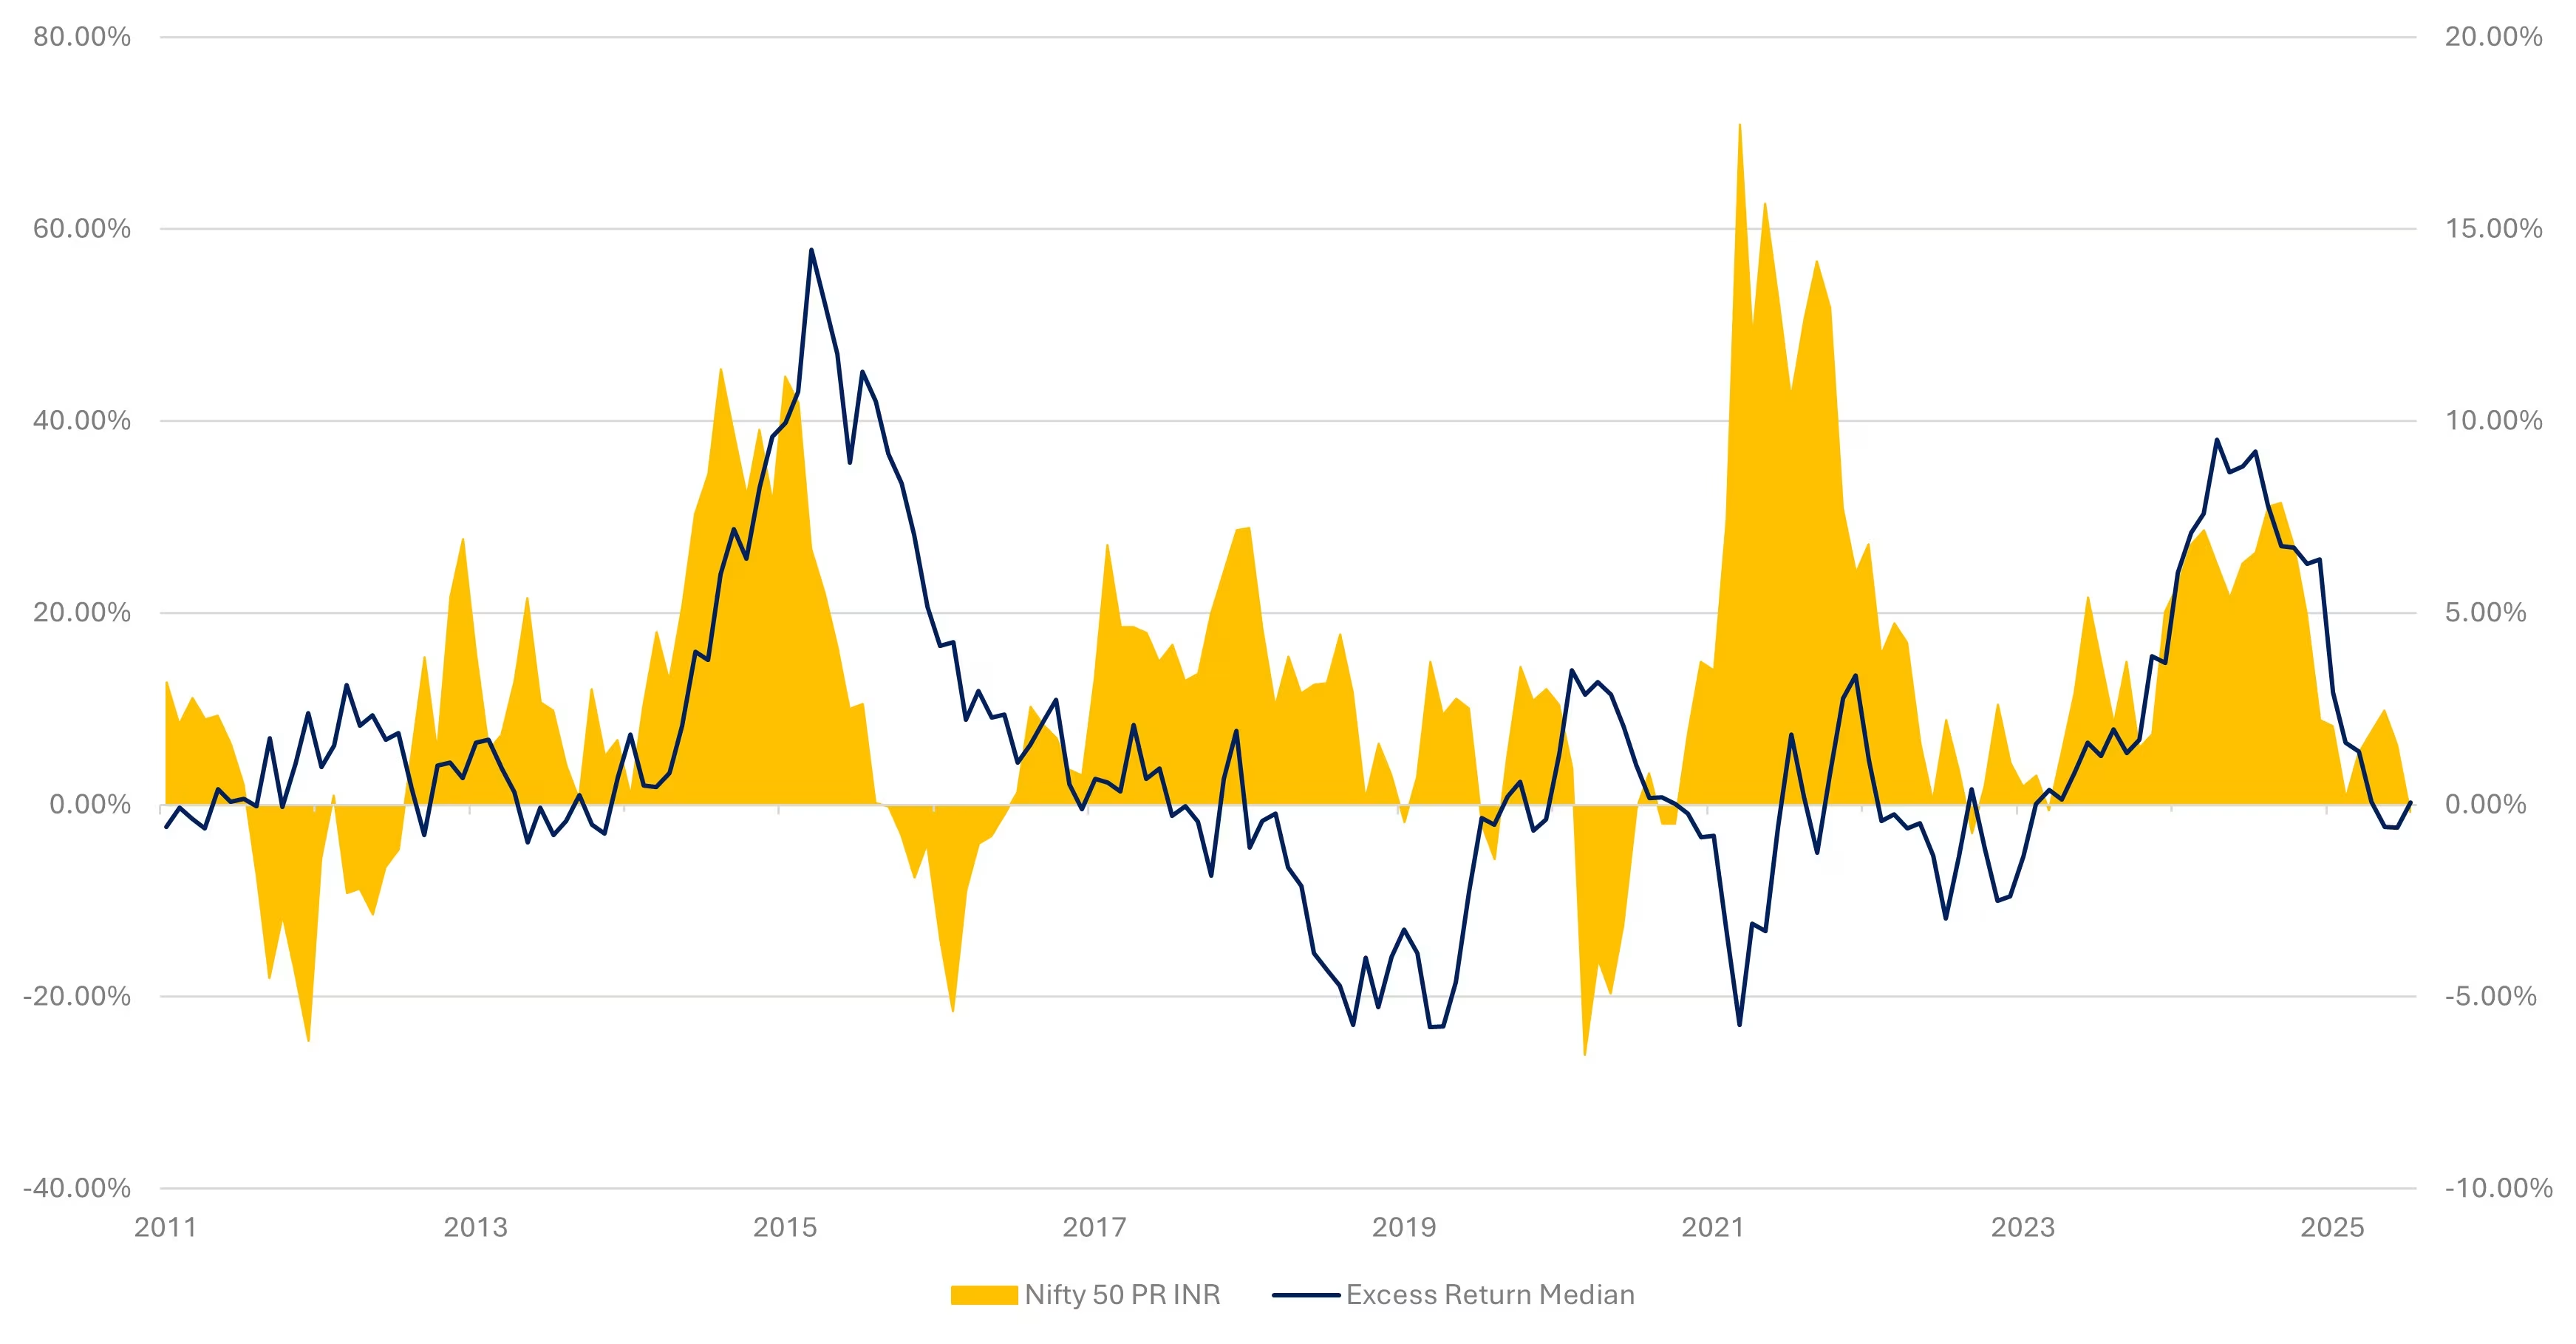
Excess returns have largely faded post-2017; funds now mirror benchmarks, with limited upside in rallies but mild outperformance in weak phases.
Total No. of Funds
No. of Outperforming Funds
% of Funds Outperforming
0% - 2%
2% - 5%
5% - 10%
10% - 15%
>15%
*Excess Return Bucketing refers to the no. of funds which has given excess return compared to the benchmark in the specified range. The highlighted cells represent majority
Large Cap
Mid-Cap: The Paradox of Strong Markets and Vanishing Alpha
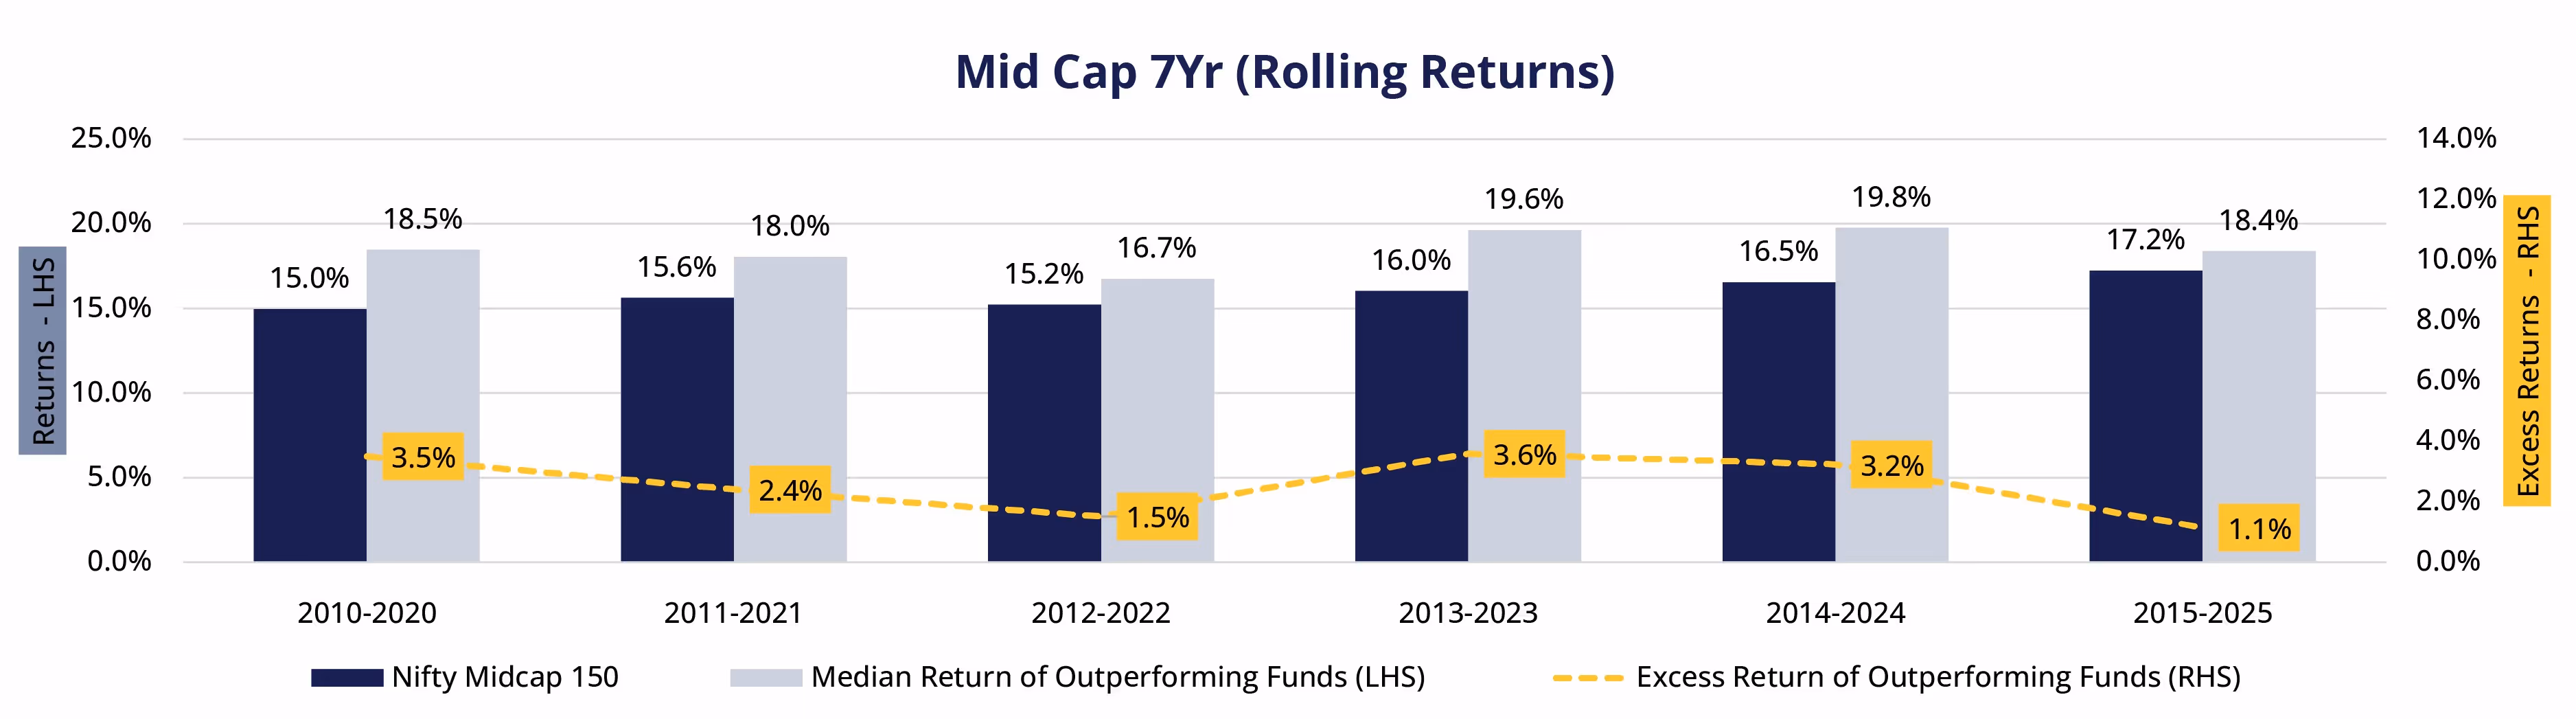
The mid-cap segment shows a clear contrast. While the index achieved high returns of 17.2% over the last decade, active funds have underperformed significantly. The percentage of funds that outperformed dropped sharply from 84% (21 out of 25 funds) to just 21% (7 out of 33). This is the biggest decline among all segments.
Looking at excess returns reveals troubling trends. The 2-5% range used to have 15 funds from 2010 to 2020, but now it has only 1 fund. The 5-10% range is gone completely. Now, the 0-2% range dominates, with 6 of the 7 funds that outperformed falling into this category, showing only slight gains.
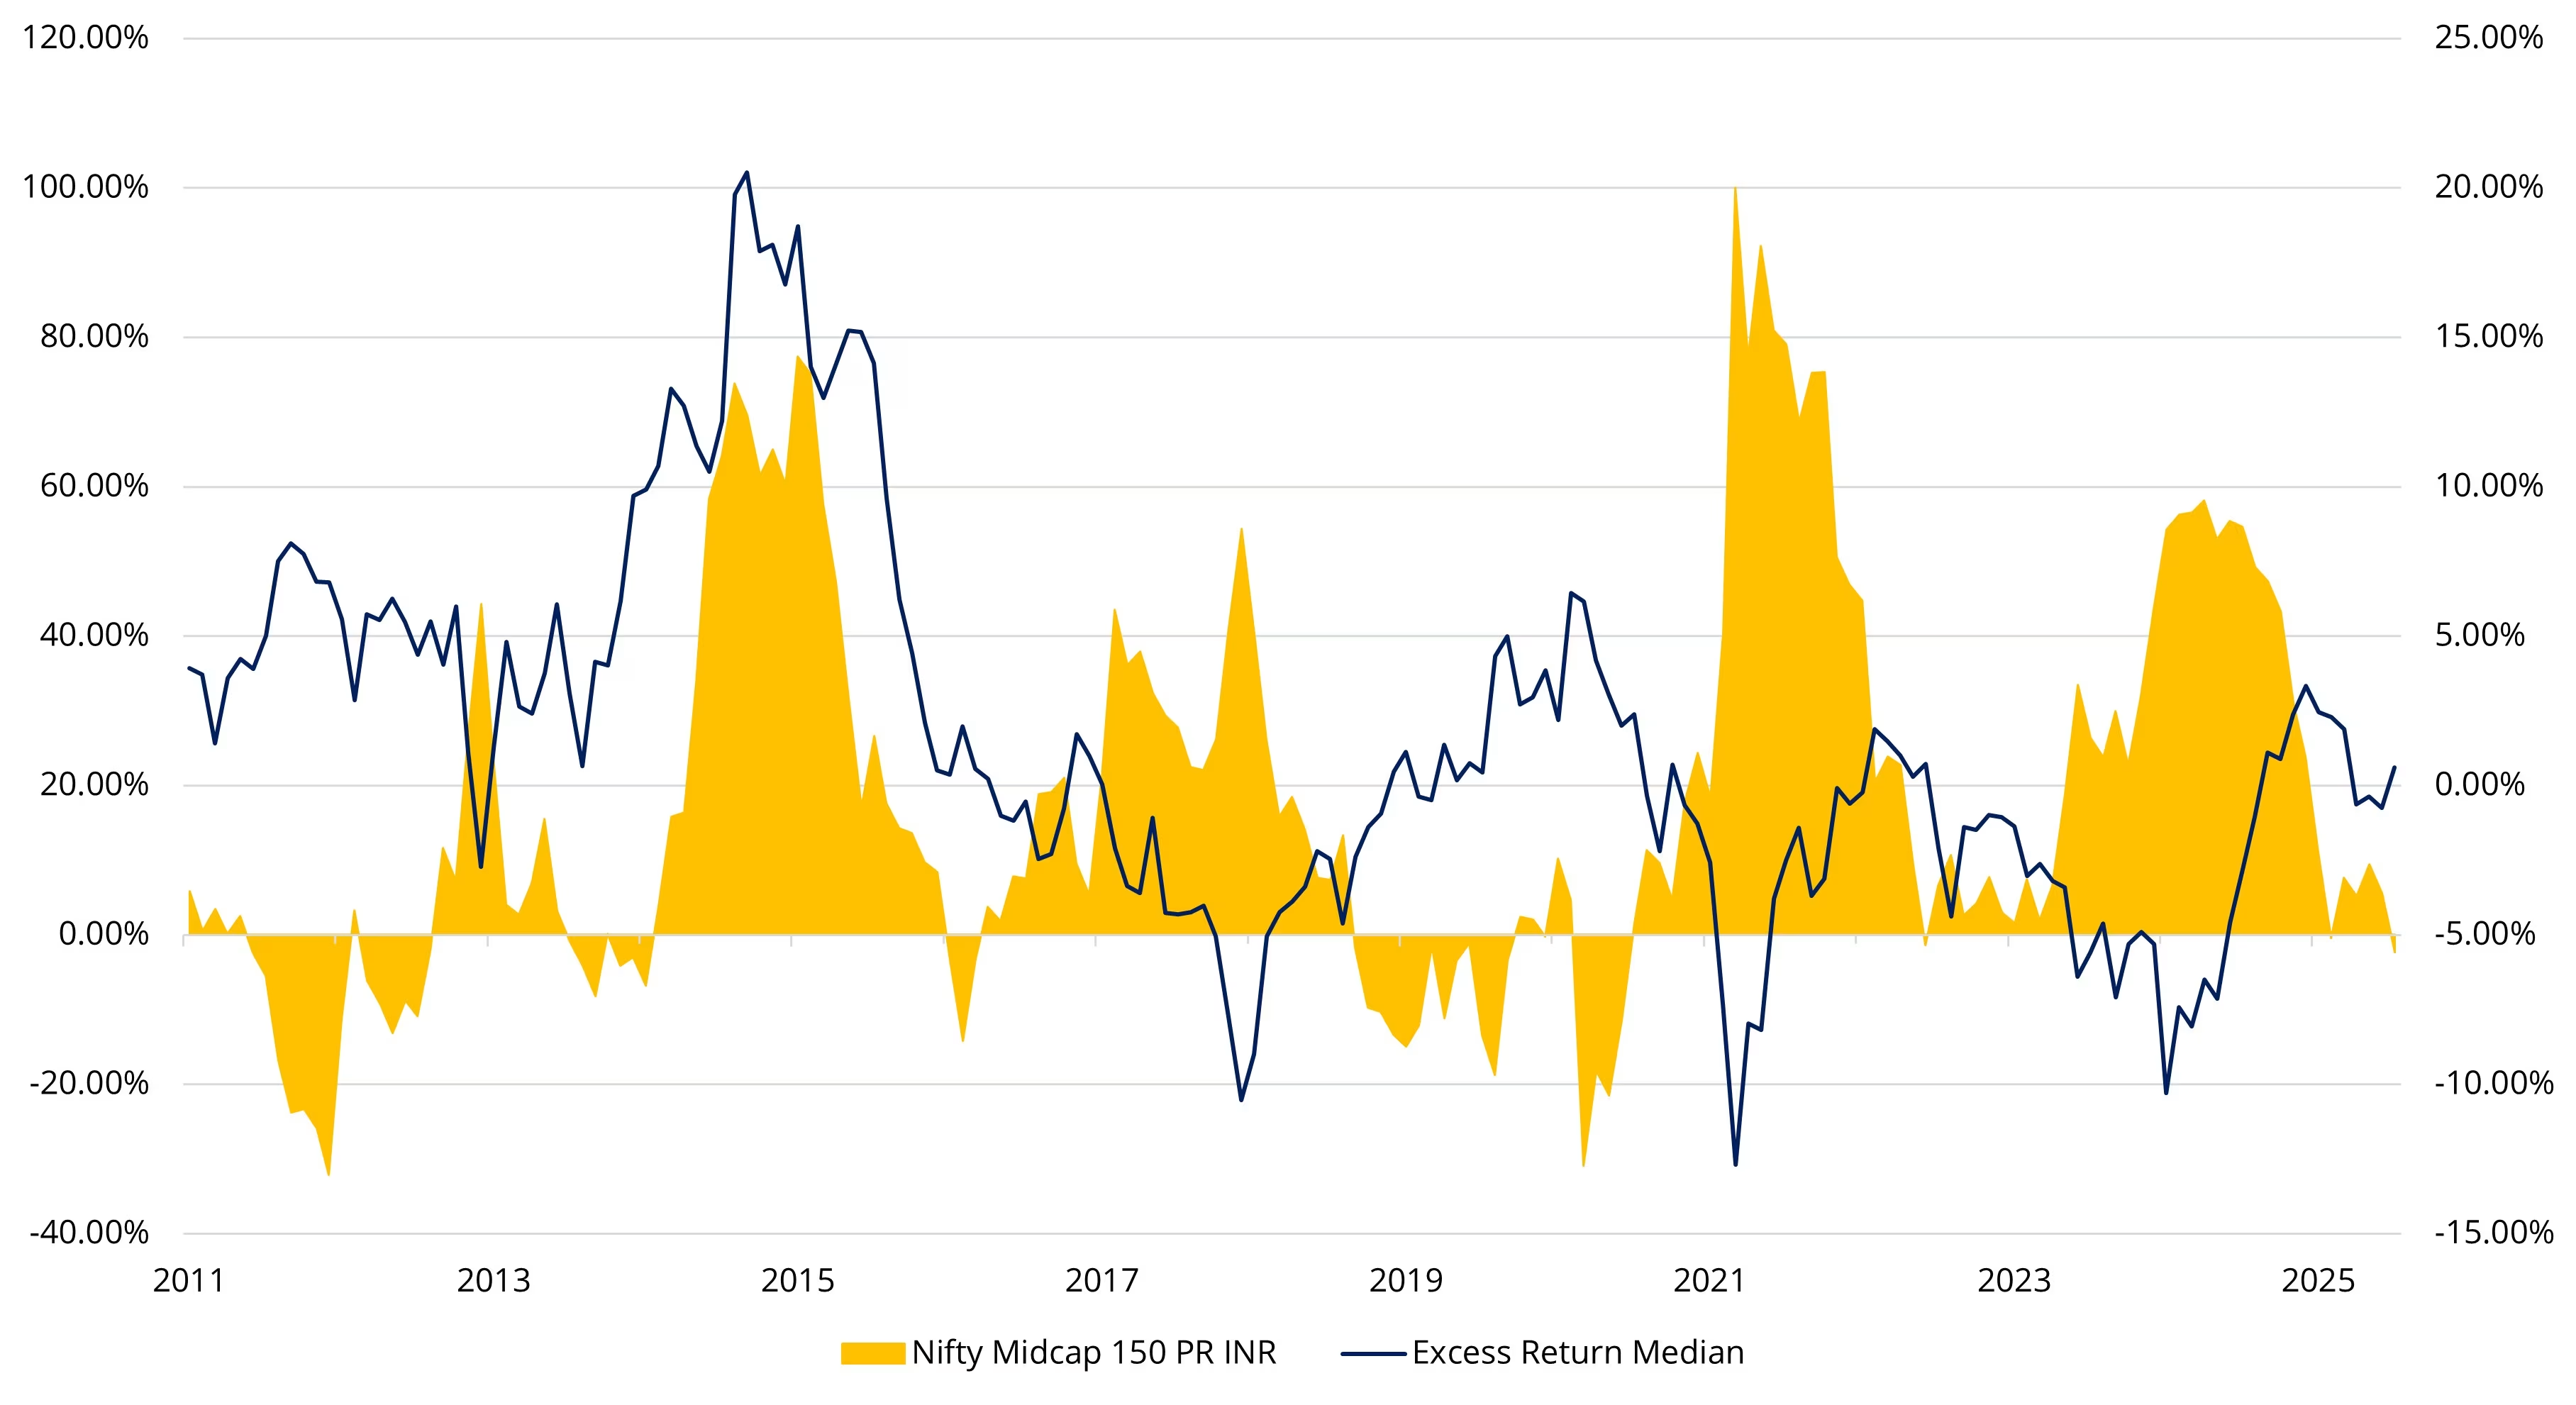
Excess returns have eroded since 2018; performance is now cycle-dependent, with shorter bursts of relative gains post-drawdowns.
Total No. of Funds
No. of Outperforming Funds
% of Funds Outperforming
0% - 2%
2% - 5%
5% - 10%
10% - 15%
>15%
*Excess Return Bucketing refers to the no. of funds which has given excess return compared to the benchmark in the specified range. The highlighted cells represent majority
Mid Cap
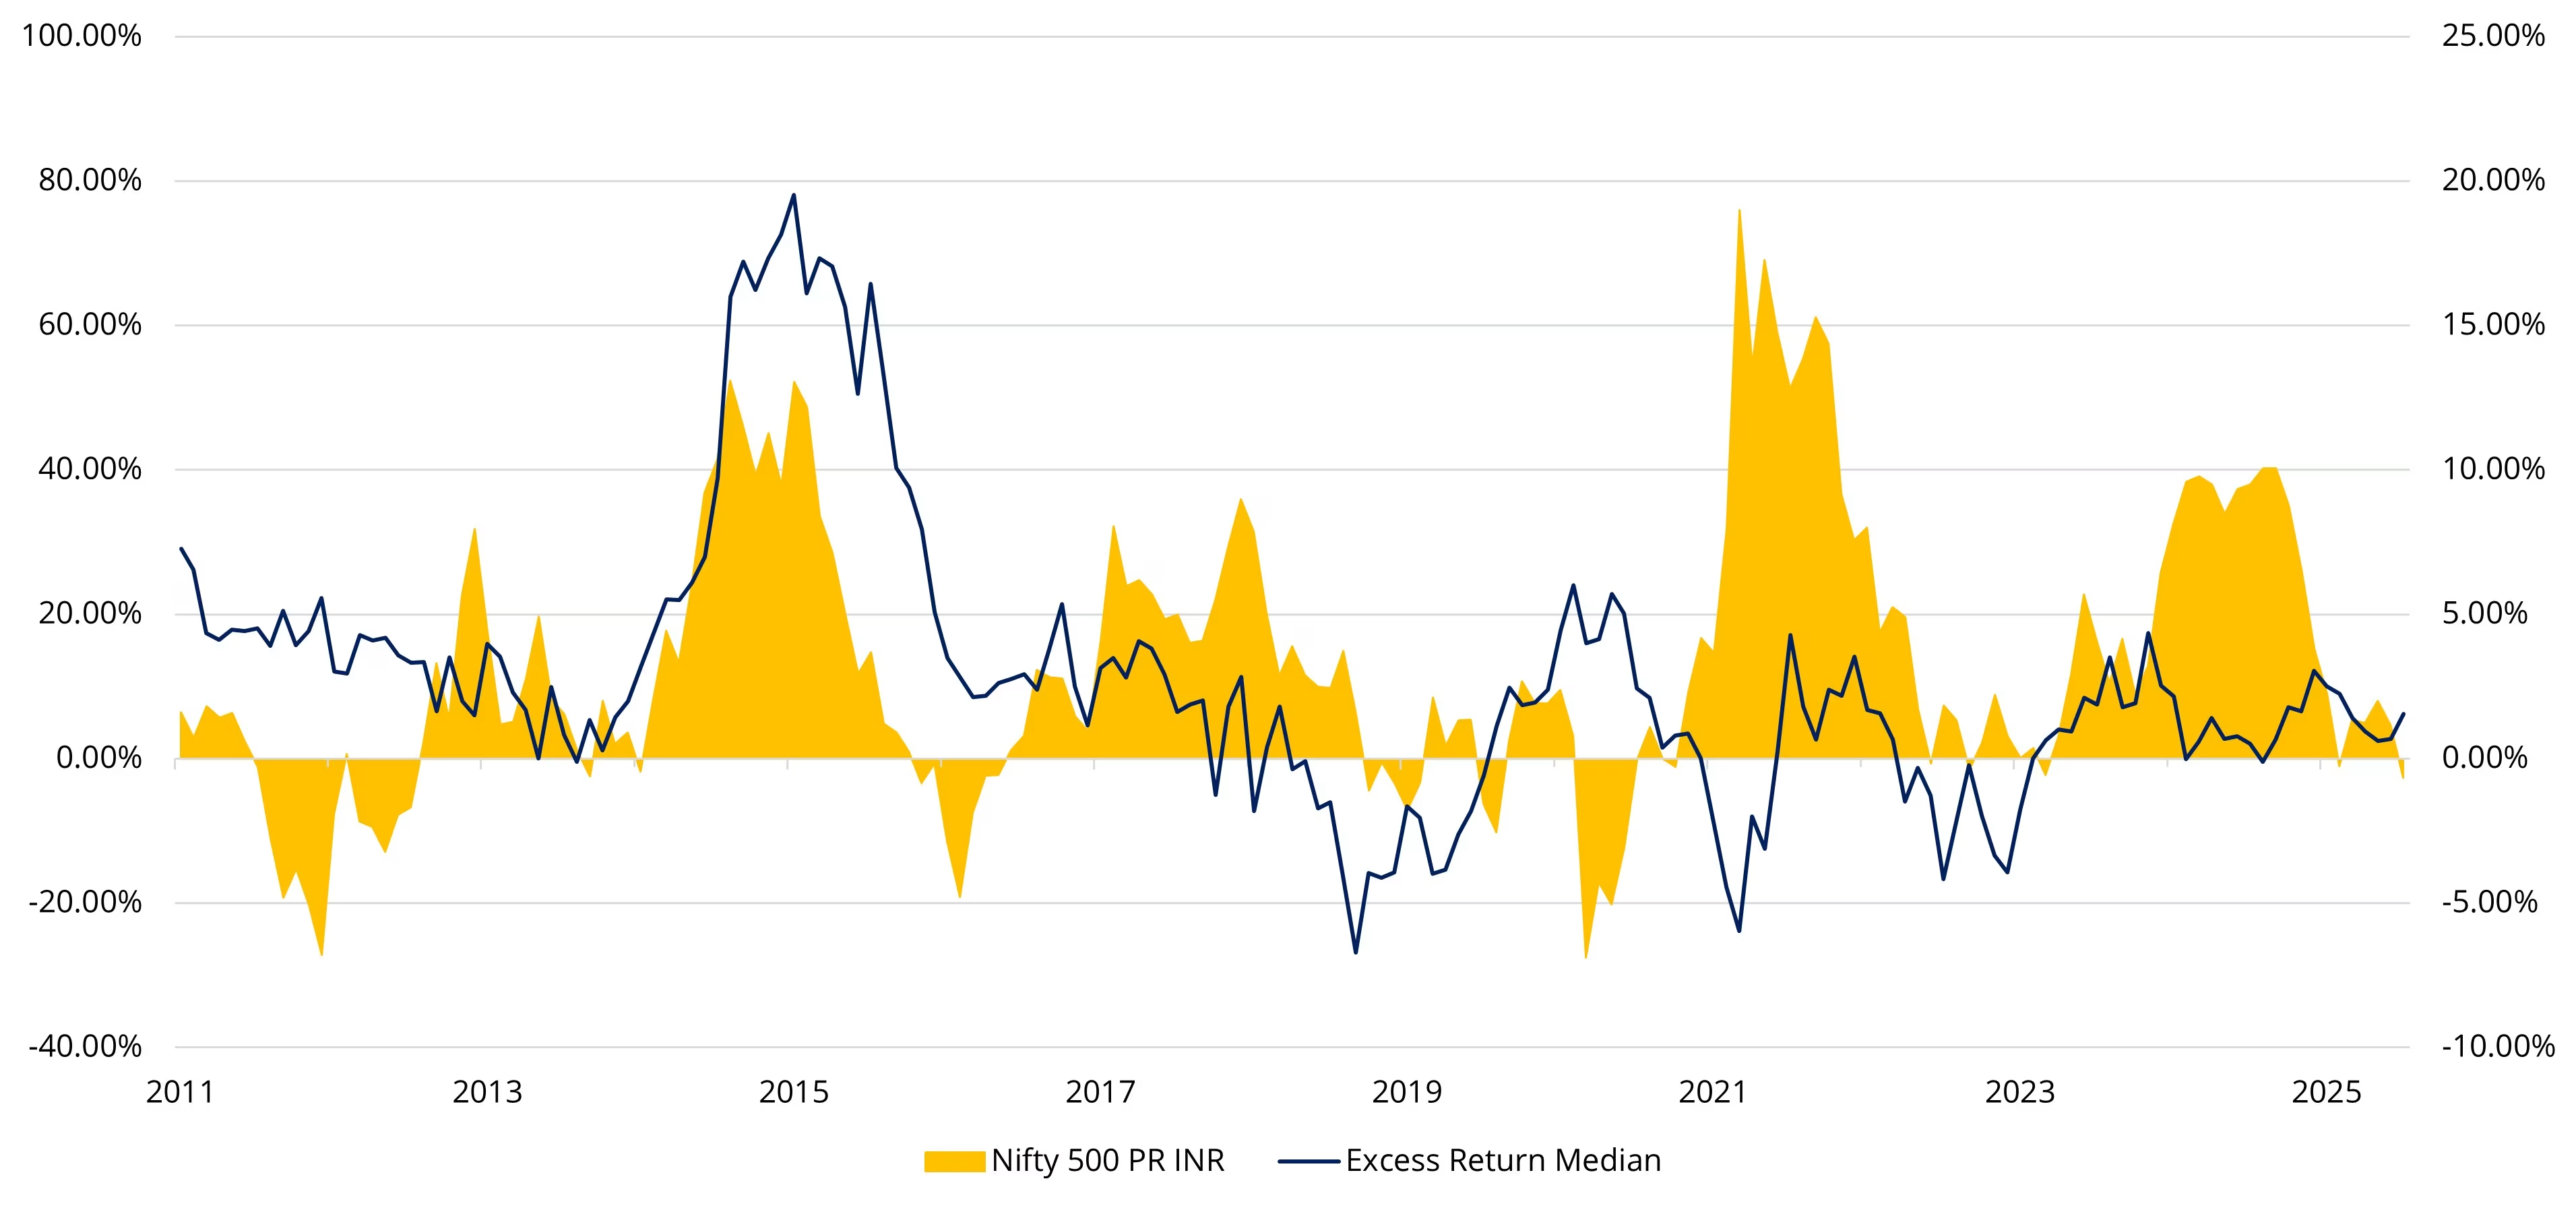
Flexi-Cap: Navigating Cyclicality and Flexibility
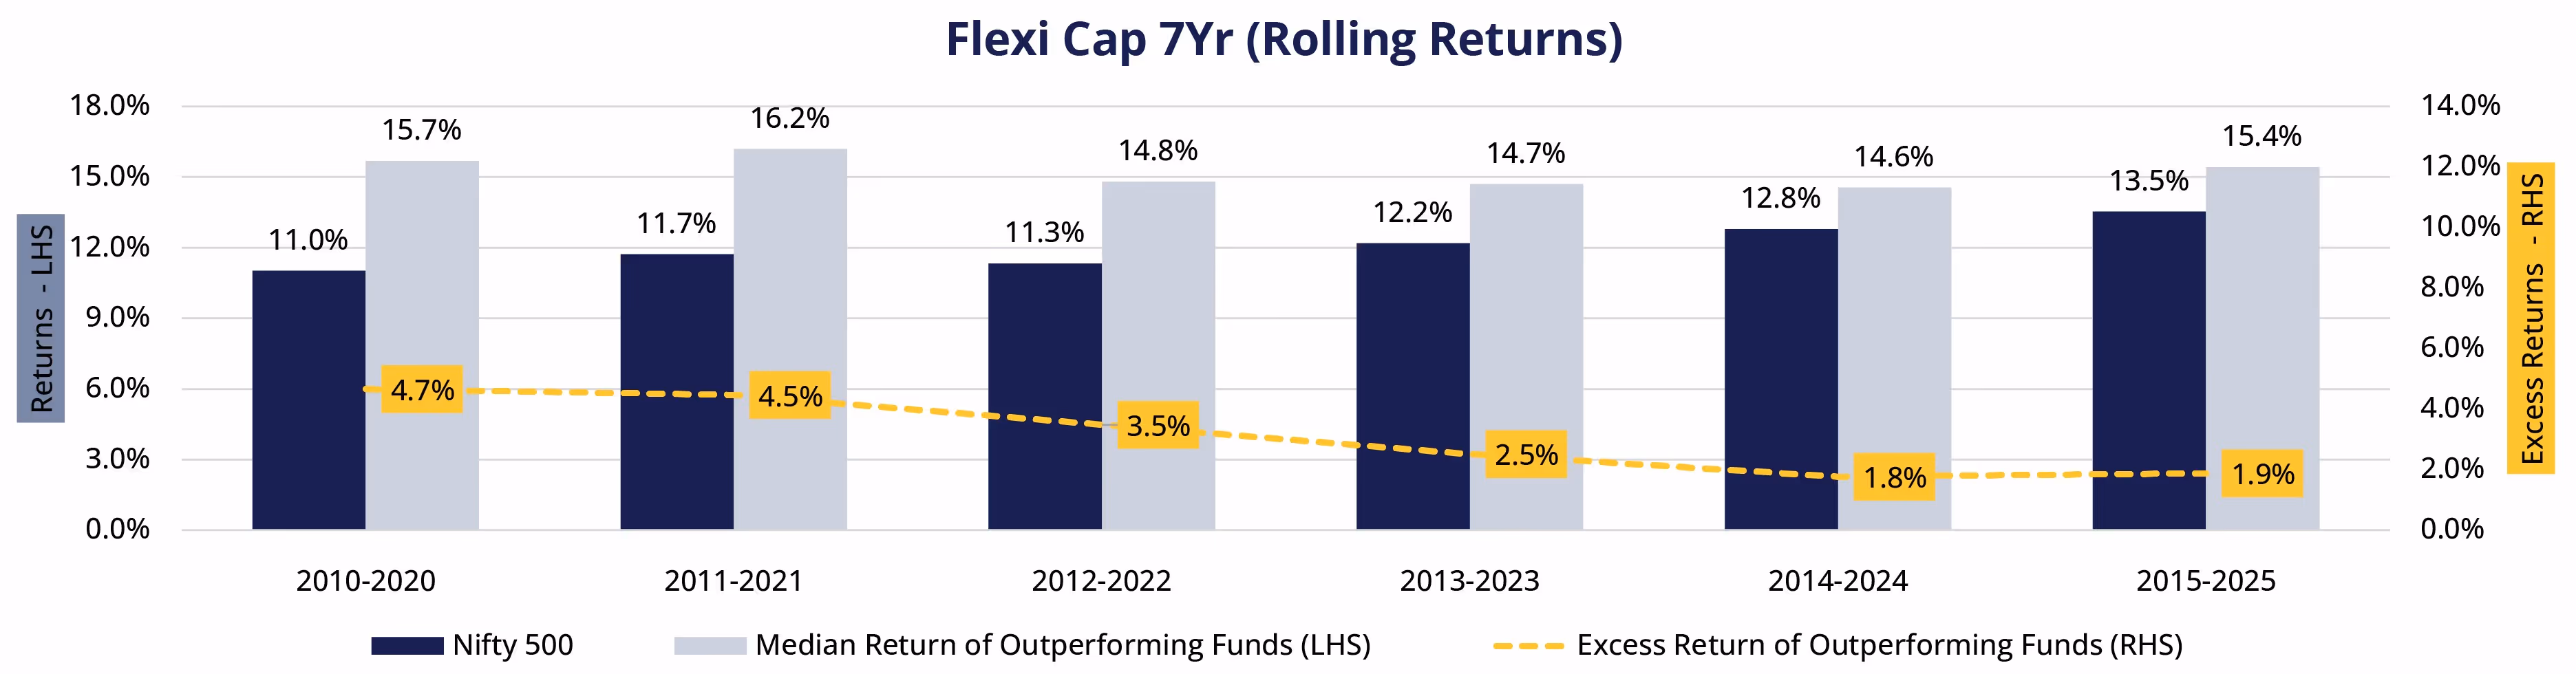
The flexi-cap category has grown significantly, increasing from 42 to 66 funds. However, the success rate has dropped from 86% to 47%. Despite this decline, the number of funds that outperform has stayed steady, between 31 and 38. This indicates that while overall skills may have decreased, there is still a mix of talent among the funds. When looking at excess returns, we see a clear split. The number of funds that achieve returns in the 0-2% range has increased to 17. At the same time, some funds continue to deliver strong returns: 9 funds fall within the 2-5% range, and 5 funds achieve returns between 5-10%.
Cyclical excess returns persist, improving during market corrections and narrowing in strong uptrends.
Total No. of Funds
No. of Outperforming Funds
% of Funds Outperforming
0% - 2%
2% - 5%
5% - 10%
10% - 15%
>15%
*Excess Return Bucketing refers to the no. of funds which has given excess return compared to the benchmark in the specified range. The highlighted cells represent majority
Flexi Cap
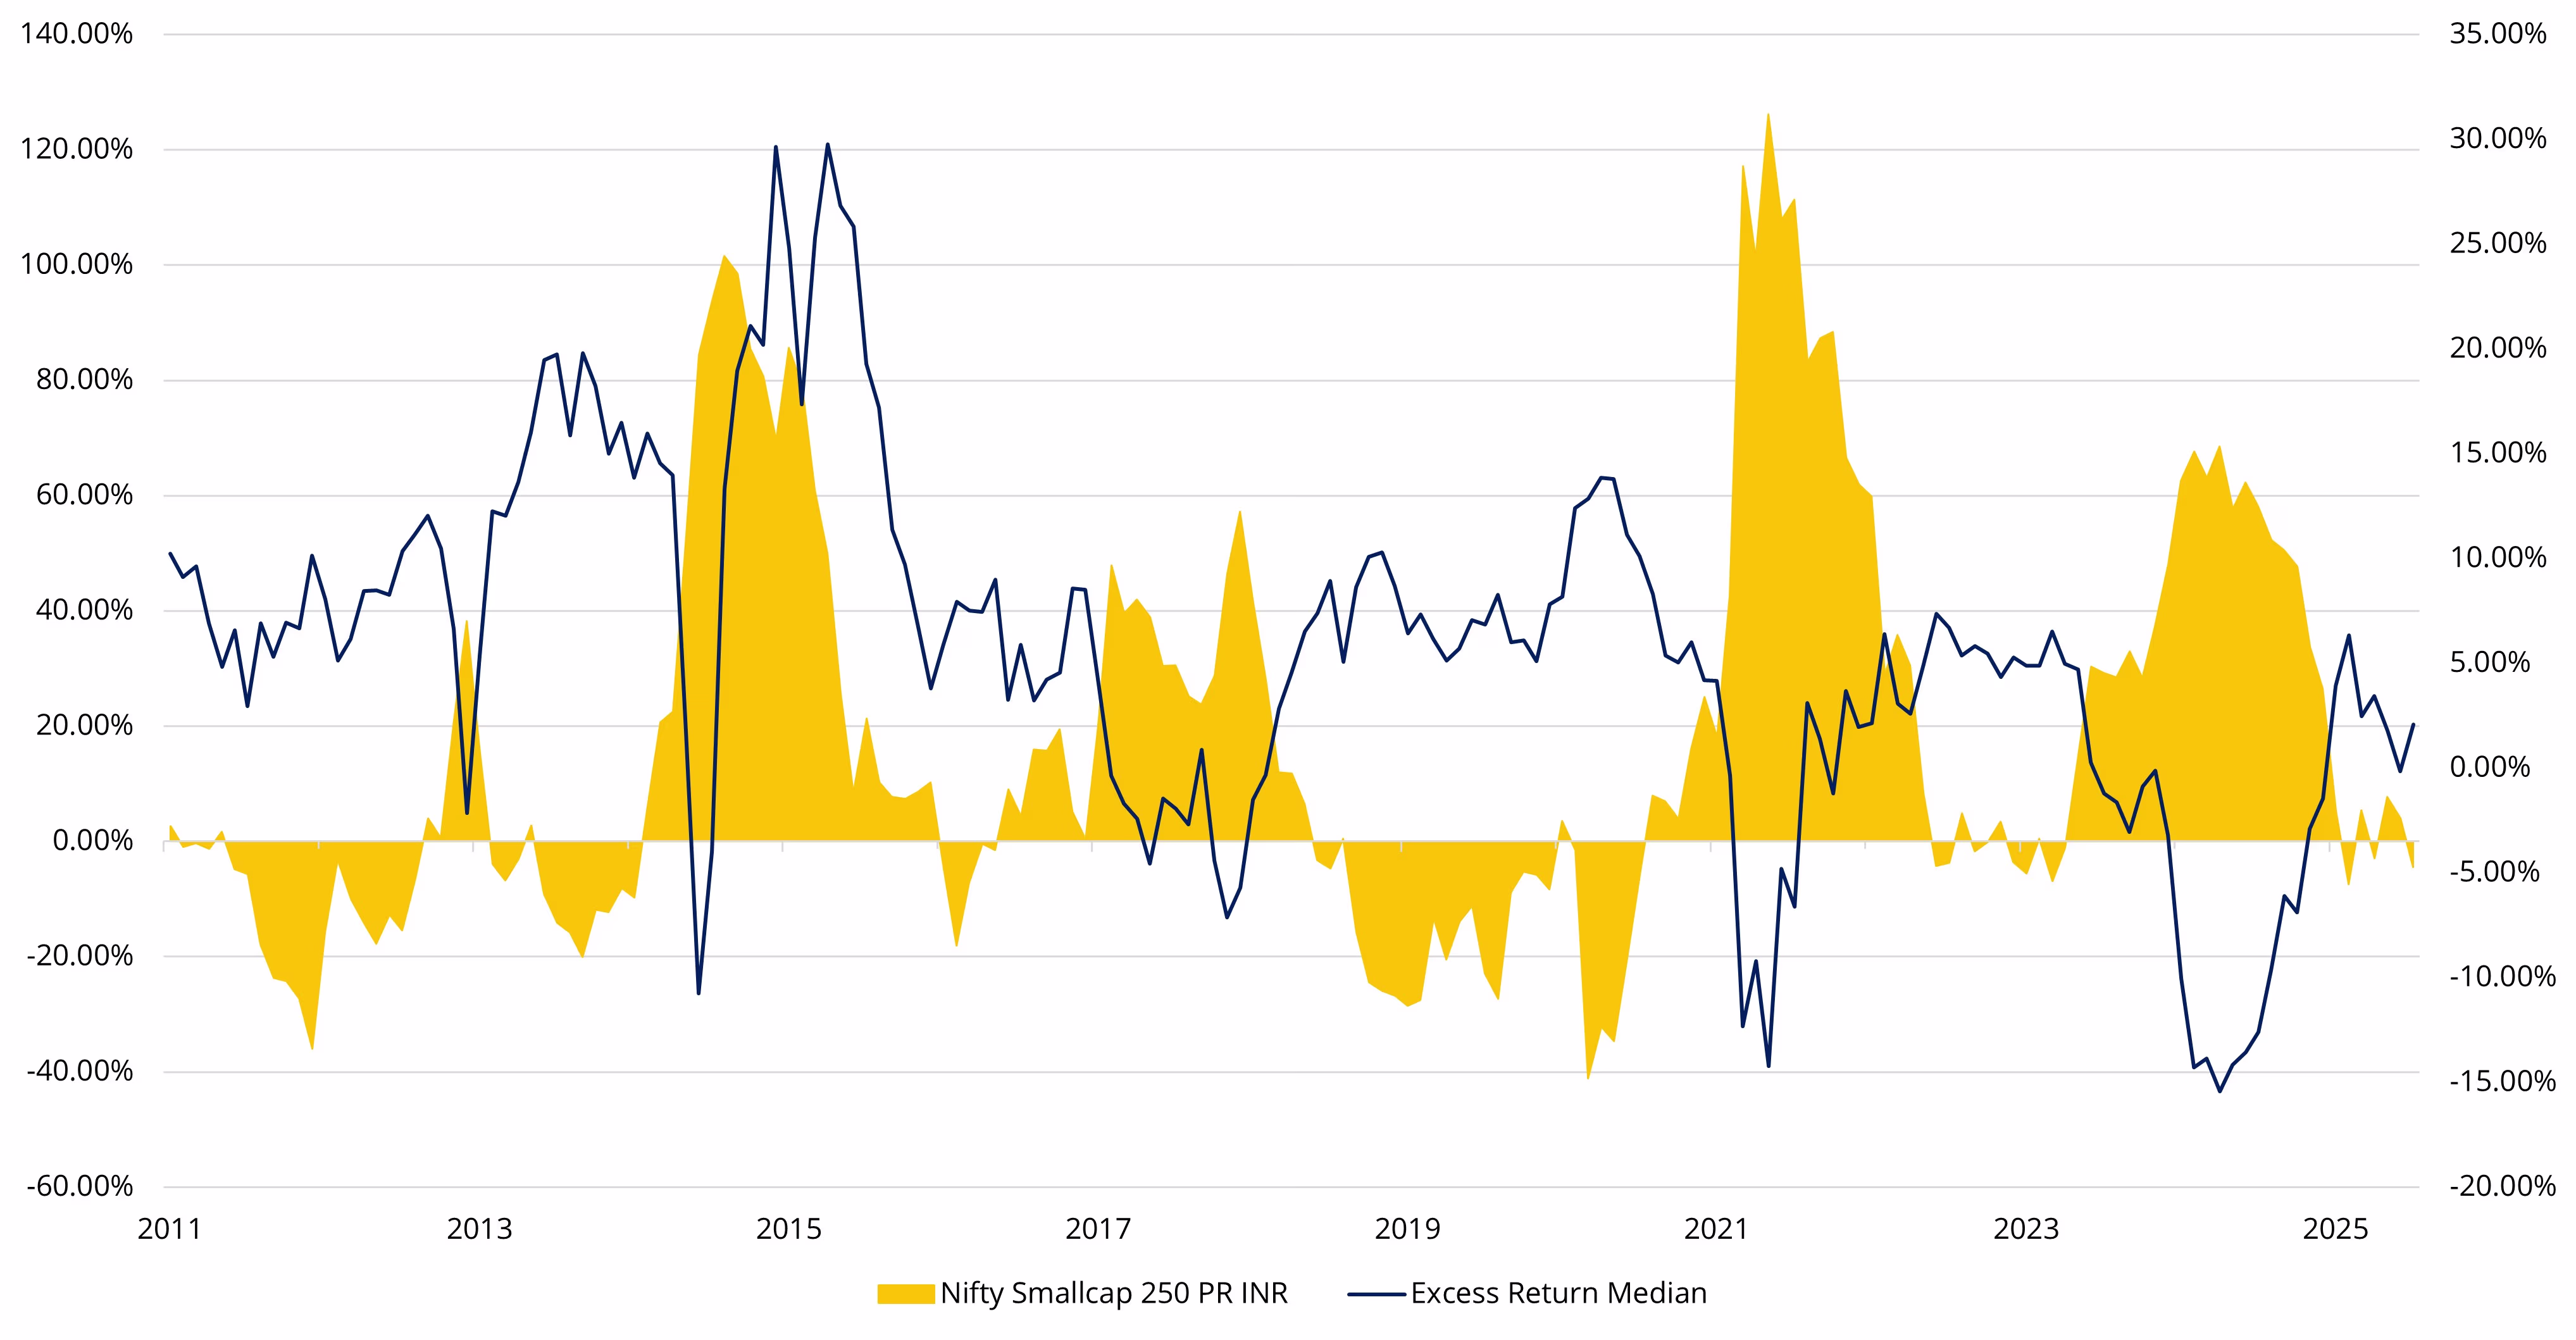
Small-Cap: Where Active Management Demonstrates Persistent Value
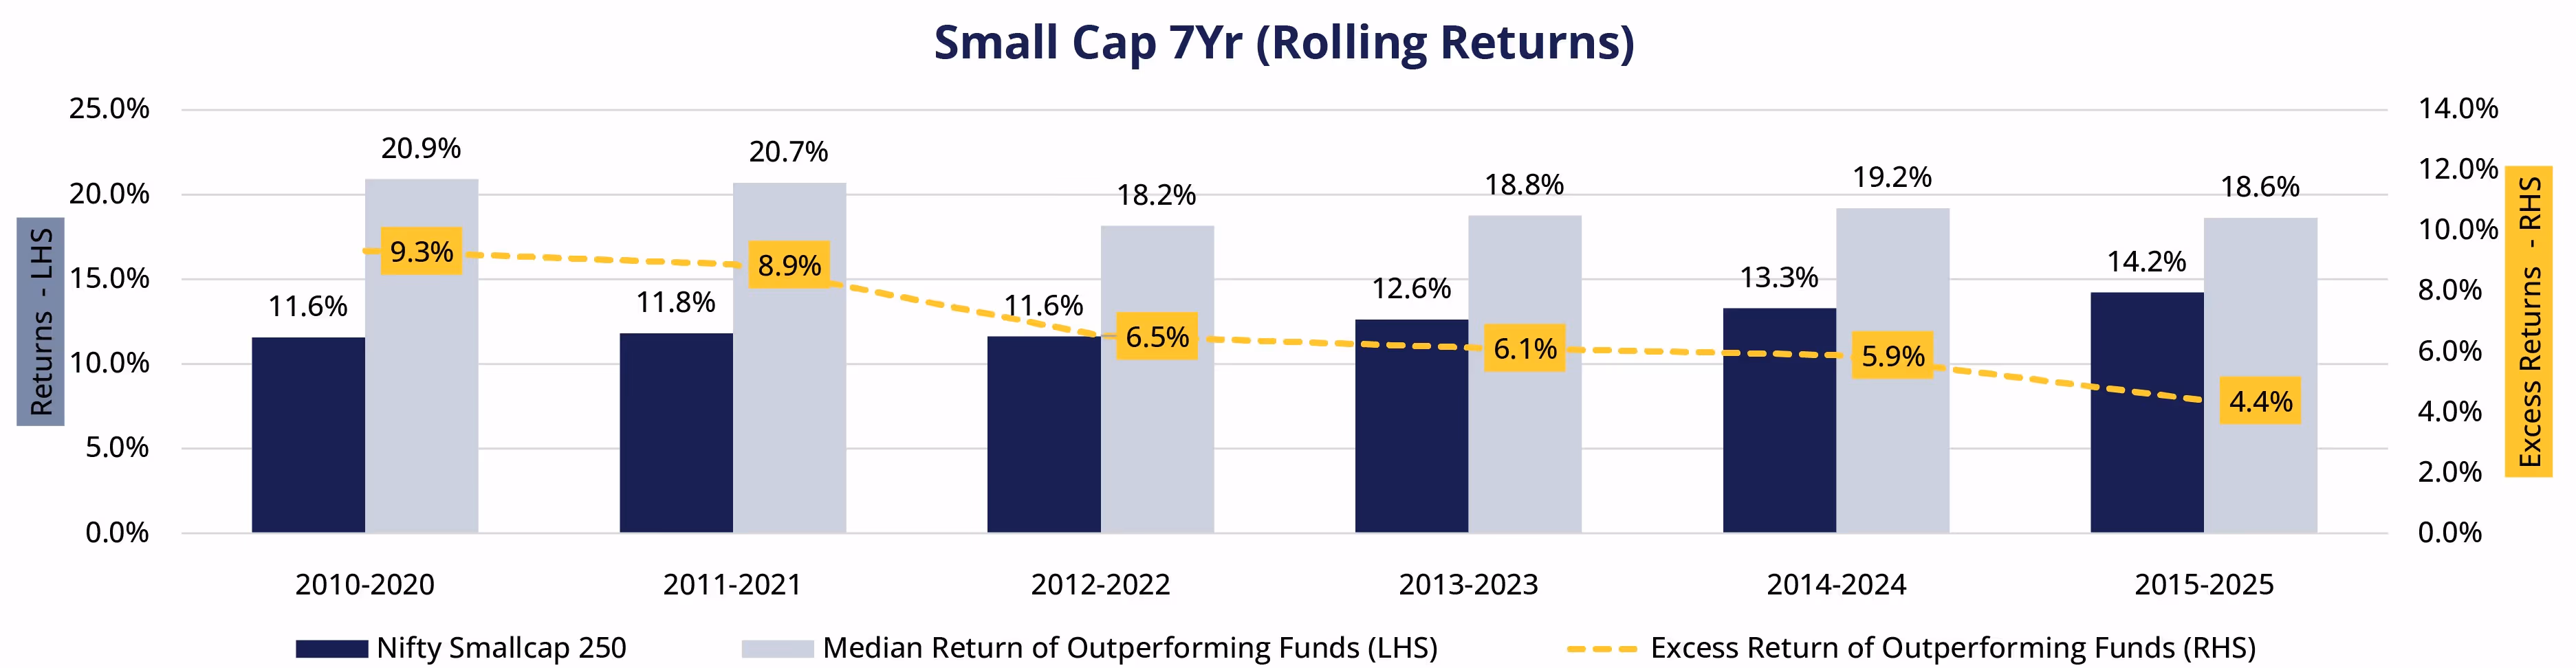
Small-cap investments are doing better than other types of investments, even though the number of funds has grown from 18 to 35. The success rate has gone down slightly from 94% to 71%, but 25 funds are still performing well, which is more than a decade ago.
The excess returns from these funds look positive: 11 funds have returns between 5-10%, another 11 funds have returns between 2-5%, and only 2 funds have returns between 0-2%. One fund has achieved returns over 15%, showing that skilled small-cap managers can consistently earn mid-to-high single-digit excess returns.
The only segment consistently generating meaningful excess returns, driven by micro cap exposure, stockl dispersion, and inverse correlation (excess returns erise when indices fall).
Total No. of Funds
No. of Outperforming Funds
% of Funds Outperforming
0% - 2%
2% - 5%
5% - 10%
10% - 15%
>15%
*Excess Return Bucketing refers to the no. of funds which has given excess return compared to the benchmark in the specified range. The highlighted cells represent majority
Small Cap
Factor Indices: The Systematic Alternative
Momentum remains the standout factor, delivering superior median rolling returns and higher Sharpe ratios, underscoring its efficiency in generating risk-adjusted alpha.
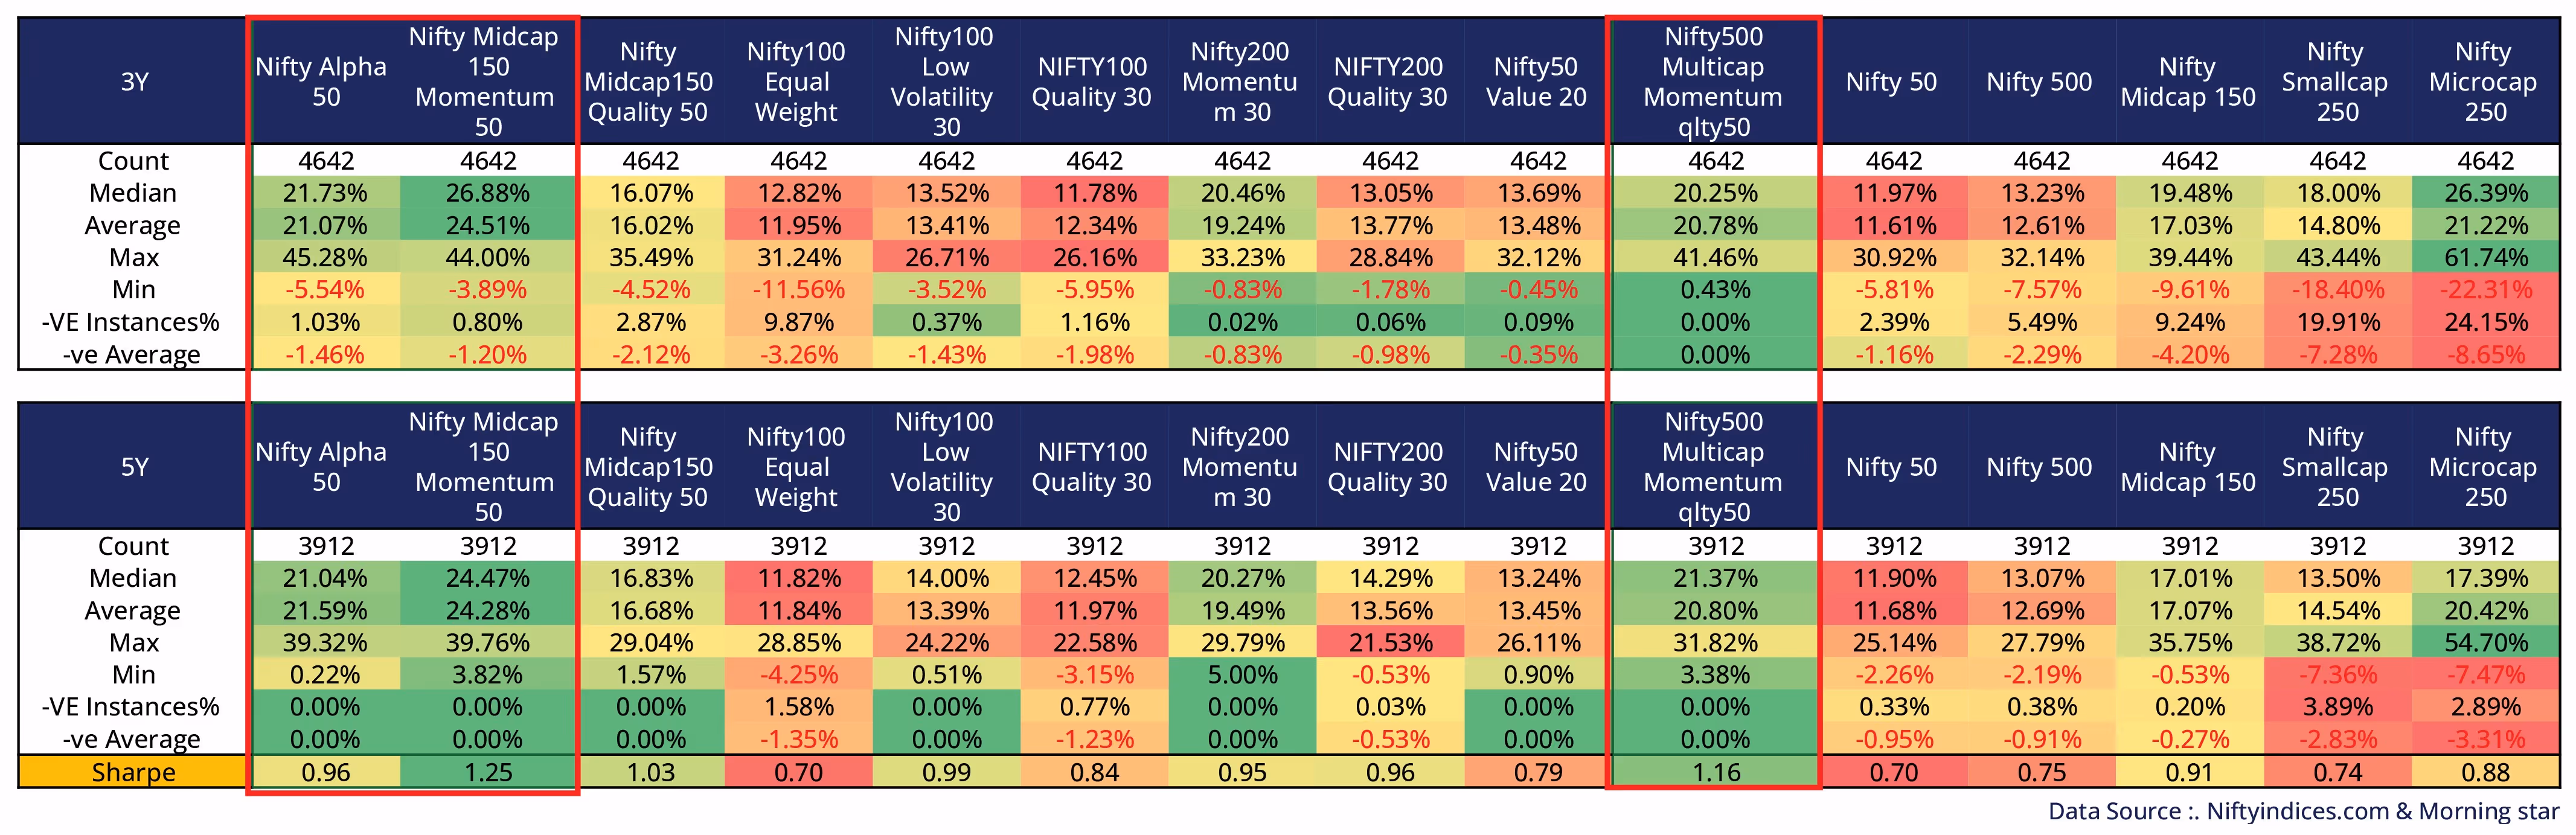
The Nifty Midcap 150 Momentum 50 leads with the highest median returns, zero negative 5-year rolling periods, and a Sharpe ratio of 1.25, highlighting both strength and stability in trend capture.
The Nifty 500 Momentum Quality 50, which blends momentum with quality, shows a Sharpe ratio of 1.16, favouring EPS-growing, fundamentally strong stocks while retaining upside capture.
The Nifty Alpha 50, derived from the top-300 large- and mid-cap stocks, carries a Sharpe ratio of 0.96; though not pure momentum, it mirrors momentum behaviour through high-returning, leadership names.
Overall, factor indices, especially momentum-based ones, have outperformed market-cap benchmarks both in absolute and risk-adjusted terms (Sharpe well above Nifty50's 0.70).
About the Author
Co-Founder & Partner
Family Office & Private Wealth
Director
Family Office & Private Wealth
Vice President
Family Office & Private Wealth
receive blogs
in your inbox!
subscribe